VMware NSX Manager application crash with Out of Memory due to large ApiTracker table on corfu db

Recently we were facing a problem on NSX control plane that suddenly crashed and became degraded. Initially we were thinking this could be solved by restarting the manager which was showing the problem. However, after the restart the problem moved to one of the other two controllers. We went on with other restarts of the entire control plane but it did not work. We noticed that the affected service is ‘Proton’ and found an OOM heap dump automatically created after the service crash:

ls /image/core
-rw-------  1 uproton uproton   37 Sep 13 21:41 proton_oom.hprof.gz

Latest after 15 minutes the problem appeared again so we suspected a memory leak and opened a SR with Broadcom. After rather short time it was discovered that ApiTracker table on corfu DB (corfu is a distributed db system built around a shared log abstraction among the NSX controllers) has had more than 10 million rows. Actually it is supposed to contain round about 1000 entries. We spent good amount of time to understand the reason since there should be an automatic cleanup job in place. This is how you can check the size of ApiTracker table:

tail -f /var/log/corfu/corfu-compactor-audit.log

Look for such output, especially for number of entries:

2024-09-13T23:23:45.020Z | INFO  |              Cmpt-chkpter-9000 |   o.c.runtime.CheckpointWriter | appendCheckpoint: completed checkpoint for 84fde90f-0df5-305f-371b-ce8b5ca4267b, entries(10030616), cpSize(2228864537) bytes at snapshot Token(epoch=1518, sequence=8128115261) in 3685860 ms

This entries are increasing because due to a bug a different table (EntityDeletionMarker) contains invalid entries. This can be if you upgraded the environment from older versions. GSS TSEs identified that this is preventing the execution of an automatic cleanup job of ApiTracker table.
This is how you can check if there are invalid entries on EntityDeletionMarker:

./corfu_tool_runner.py --tool corfu-browser -n nsx -o showTable -t EntityDeletionMarker

After cleaning it up (do it only with GSS!) we were optimistic that the automatic job would kick in to clear the ApiTracker table.

./corfu_tool_runner.py -n nsx -t EntityDeletionMarker -o clearTable

We were waiting two iterations (the job is starting every 15 minutes), however we noticed after 50 minutes it crashed and the node was again out of memory. So there was no other way than to increase the memory size of the controllers. This is unsupported and should be done only as last resort with GSS assistance. The memory can be increased by modifying this file:

/usr/tanuki/conf/proton-tomcat-wrapper_48gb.conf

And afterwards the controller need to be increased on virtual Machine level. In our case we put the Java Hep Size from 12% to 19.8%.

Finally, this fixed the issue and let the job complete the cleanup.

2024-09-13T22:22:19.068Z | INFO  |              Cmpt-chkpter-9000 |     o.c.runtime.view.SMRObject | ObjectBuilder: open Corfu stream nsx$ApiTracker id 84fde90f-0df5-305f-371b-ce8b5ca4267b
2024-09-13T22:22:19.158Z | INFO  |              Cmpt-chkpter-9000 |   o.c.runtime.CheckpointWriter | appendCheckpoint: Started checkpoint for 84fde90f-0df5-305f-371b-ce8b5ca4267b at snapshot Token(epoch=1518, sequence=8128115261)
2024-09-13T23:23:45.020Z | INFO  |              Cmpt-chkpter-9000 |   o.c.runtime.CheckpointWriter | appendCheckpoint: completed checkpoint for 84fde90f-0df5-305f-371b-ce8b5ca4267b, entries(10030616), cpSize(2228864537) bytes at snapshot Token(epoch=1518, sequence=8128115261) in 3685860 ms
2024-09-14T02:03:37.319Z | INFO  |              Cmpt-chkpter-9000 |     o.c.runtime.view.SMRObject | ObjectBuilder: open Corfu stream nsx$ApiTracker id 84fde90f-0df5-305f-371b-ce8b5ca4267b
2024-09-14T02:03:37.470Z | INFO  |              Cmpt-chkpter-9000 |   o.c.runtime.CheckpointWriter | appendCheckpoint: Started checkpoint for 84fde90f-0df5-305f-371b-ce8b5ca4267b at snapshot Token(epoch=1528, sequence=8130630447)
2024-09-14T02:18:35.227Z | INFO  |              Cmpt-chkpter-9000 |   o.c.runtime.CheckpointWriter | appendCheckpoint: completed checkpoint for 84fde90f-0df5-305f-371b-ce8b5ca4267b, entries(180000), cpSize(41796720) bytes at snapshot Token(epoch=1528, sequence=8130630447) in 897757 ms
2024-09-14T02:36:41.732Z | INFO  |              Cmpt-chkpter-9000 |     o.c.runtime.view.SMRObject | ObjectBuilder: open Corfu stream nsx$ApiTracker id 84fde90f-0df5-305f-371b-ce8b5ca4267b
2024-09-14T02:36:41.840Z | INFO  |              Cmpt-chkpter-9000 |   o.c.runtime.CheckpointWriter | appendCheckpoint: Started checkpoint for 84fde90f-0df5-305f-371b-ce8b5ca4267b at snapshot Token(epoch=1528, sequence=8130913177)
2024-09-14T02:36:43.122Z | INFO  |              Cmpt-chkpter-9000 |   o.c.runtime.CheckpointWriter | appendCheckpoint: completed checkpoint for 84fde90f-0df5-305f-371b-ce8b5ca4267b, entries(839), cpSize(209764) bytes at snapshot Token(epoch=1528, sequence=8130913177) in 1281 ms
2024-09-14T02:51:30.477Z | INFO  |              Cmpt-chkpter-9000 |     o.c.runtime.view.SMRObject | ObjectBuilder: open Corfu stream nsx$ApiTracker id 84fde90f-0df5-305f-371b-ce8b5ca4267b

Horizon UAGs with chained Load Balancers – a Lab Demo

Hi! This week, I’ve been exploring options for a Horizon Environment that applies specific rules based on users’ origins (network addresses / IP addresses). For instance, certain users should be redirected to a Load Balancer with Unified Access Gateways (UAGs), while others should be sent directly to Connection Servers. The goal is to establish fine granularity and to test redirects from one load balancer to another for less trusted source networks, in order to enforce Multi-Factor Authentication (MFA) for such users.

The test lab consists out of:

  • Horizon Connection Server (labcs1)
  • 2 x Unified Access Gateway (labug1 & labug2)
  • 2 x HAProxy LB (lablb1 & lablb2)
  • “simulated” Workstations 172.16.0.20 & .21
  • Virtual RDS labcl1

Leveraging on HAProxy ACLs the traffic should – depending on the originating IP address (.21 or default) – either be redirected through lablb2 and its connected UAG or just pass straight away towards the connection server labcs1.

Why this can be useful?

Imagine a scenario in which the end users are connecting from less trusted networks (e.g. through VPN zone) and you want to tunnel the session to hide the desktops in the backend or to enable MFA on UAGs in this path. Of course you could share two endpoints for the Users or work with DNS to point them to different LTMs. But still there might be some scenarios in which you want to work with redirects on the first LTM in the chain, e.g. when manipulating DNS is not possible for any reason.

So, lets get into it starting with the drawing of the lab.

Infra Drawing

The most important aspect is the LB configuration. lablb1 is a HAProxy Appliance which works as L7 Loadbalancer configured with an ACL rules:

When source IP matches 172.16.0.21 it is redirected via HTTP 302 to lablb2.
Important: When the path contains /broker/xml it is redirected via HTTP 307 to lablb2, otherwise the connection via Horizon Client will not work. (HTTP 403 or HTTP 405 error will occure)

# Sample HAProxy configuration of lablb1

frontend incoming_ssl_traffic
  bind *:443 ssl crt /certs/cert.pem
  mode http
  option http-server-close
  option forwardfor

  acl source_ip_is_lablb2 src 172.16.0.21
  acl path_is_broker_xml path_beg /broker/xml

  http-request redirect location https://lablb2.lab.local/broker/xml code 307 if source_ip_is_lablb2 path_is_broker_xml
  http-request redirect location https://lablb2.lab.local/ code 302 if source_ip_is_lablb2 !path_is_broker_xml

  default_backend memberservers_backend

backend memberservers_backend
  mode http
  balance roundrobin
  server member1 172.16.0.31:443 check

Instead the lablb2 configuration works in L4 mode, accepts TCP 443 (primary session protocol) and TCP 8443 (secondary session protocol) for BLAST traffic.

# Sample HAProxy configuration of lablb2

frontend incoming_443
  bind *:443
  mode tcp
  default_backend myservers_443

frontend incoming_8443
  bind *:8443
  mode tcp
  default_backend myservers_8443

backend myservers_443
  mode tcp
  balance source
  server labug1.lab.local 172.16.0.41:443 check
  server labug1.lab.local 172.16.0.42:443 check

backend myservers_8443
  mode tcp
  balance source
  server labug1.lab.local 172.16.0.41:8443 check
  server labug1.lab.local 172.16.0.42:8443 check

I have also tested to run lablb2 in L7 mode, however it was not possible to establish a tunneled session. I have always encountered this error:

Could not establish tunnel connection

The Loadbalancing Methods

As per this article: https://techzone.vmware.com/resource/load-balancing-unified-access-gateway-horizon#secondary-horizon-protocols VMware supports 3 methods of load balancing UAGs:

  1. Source IP Affinity
  2. Multiple Port Number Groups
  3. Multiple VIPs

In the lab method 1 was used. However, there might be scenarios where it is not possible to rely on source ip affinity. In such case my favourite option is ‘Multiple Port Number Groups’ with a 1:1 mapping of UAG and Connection Server (UAG will automatically shut off its service when there is an issue on a connection server). I favour this method because the traffic flow is clear and transparent which is not always the case for the other methods, especially in large environments.

I do not touch in this post persistence or stickiness settings, just be aware to study this KB carefully before starting a deployment: https://kb.vmware.com/s/article/56636
There is a default heartbeat interval of 30 minutes that should be respected, if this is missed 3 times (90 minutes) the session will drop.

The UAG configuration with Source IP Affinity configuration

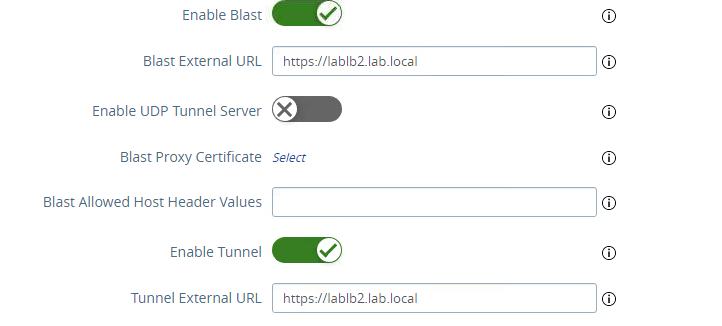
With source ip affinity the configuration is very simple, within the Horizon Settings section the Blast External URL and Tunnel External URL need to be configured to point to https://lablb2.lab.local by default the Blast External URL will point to TCP 8443 while the Tunnel External URL is on TCP 443. The Blast External URL can also be changed to TCP 443 or other ports if desired.

Testing the configuration

To verify if the configuration works I run multiple connection attempts from the simulated test workstations 172.16.0.20 and .21. Both test workstations were able to connect to a Desktop via Browser and via Horizon Client. For .21 the redirect to lablb2 works as desired and therefore .21 was able to establish a tunneled session.

Instead for the test workstation .20 no redirect was in place and it directly established the session with the Desktop without being tunneld through a UAG.

Bug Alert: VIFs get deleted when adding Host to VDS on NSX 4.1.1 in security-only deployment

NSX in security-only deployment has a long history of critical bugs such as “NSX-T DFW rules are not applied to VMs in security only environments” (https://kb.vmware.com/s/article/91390) but recently I came accross a new bug that is larger than anything that has happened before on the security-only deployment:

Adding a new Host without NSX installed to a VDS on NSX 4.1.1 while there are NSX prepared and at the same time not NSX prepared Clusters attached to the same VDS can cause a rare race-condition. The cleanup task, which is supposed to run on the cluster or standalone Host that isn’t prepared for NSX yet, mistakenly sees the TNP and TZ of of other clusters sharing the VDS as stales and tries to delete them.

Ultimately this can lead to a situation in which all VIFs (virtual interfaces) are getting deleted and therefore Firewall-Rules can no more be applied which results in a fallback to the default rule: deny any-any.

On NSX side basically all ports are gone. To confirm the symptoms also above mentioned KB is useful because it contains the necessary instructions to gather information about the applied FW rules.

summarize-dvfilter | grep -A 9 <vm-name.eth0>

vsipioctl getrules -f <nic name>

Btw, this bug is not present when overlay-networking is in use.

The fastest resolution path to establish the VIFs and connectivity again is to vMotion the affected VMs between the Hosts. This will re-create the deleted items and local control plane information.

A patch for this bug is not available yet. But is expected soon.

Here below are some syslog examples taken from a lab that could indicate such problem.

<193>2024-02-07T09:14:59.069Z esxi01.lab.local nsx-opsagent[2102003]: NSX 2102003 - [nsx@3987 comp="nsx-esx" subcomp="opsagent" s2comp="nsxa" tid="4290638" level="INFO"] [DoVifPortOperation] request=[opId:[MP-initiated-detach-1717293235760] op:[MP_DETACH_PORT(1003)] vif:[] ls:[odh34b15-34c3-4a58-89d8-b64fdb5da67h] vmx:[] lp:[610a9cc0-c7d4-45d2-877e-e9e3d1542125]]
<193>2024-02-07T09:14:59.683Z esxi01.lab.local cfgAgent[2101722]: NSX 2101722 - [nsx@3987 comp="nsx-controller" subcomp="cfgAgent" tid="33234501" level="info"] Delete logical switch [b7b1849b-0fb8-4141-9986-bd8548ebf61e]
<193>2024-02-07T09:14:59.683Z esxi01.lab.local cfgAgent[2101722]: NSX 2101722 - [nsx@3987 comp="nsx-controller" subcomp="cfgAgent" tid="33234501" level="warn"] LSP_SWITCH_ID is not found for port [c5743555-dc17-53d7-b297-b28d57bd6c08]
<193>2024-02-07T09:14:59.683Z esxi01.lab.local cfgAgent[2101722]: NSX 2101722 - [nsx@3987 comp="nsx-controller" subcomp="cfgAgent" tid="33234501" level="info"] l2: invalid routingDomainID for LS b7b1849b-0fb8-4141-9986-bd8548ebf61e, skip deleting
<193>2024-02-07T09:15:25.378Z esxi01.lab.local nsx-opsagent[2102003]: NSX 2102003 - [nsx@3987 comp="nsx-esx" subcomp="opsagent" s2comp="nsxa" tid="4290638" level="WARNING"] [PortOp] Port [3d32d347-ab49-4d45-cb32-dfa0ge91554f] state get failed, error code [bad0003], skip clearing VIF

VMware Aria Operations REST API – REPORTS

Hello! In this rather quick guide I want to show you how you can quickly retrieve Aria Operations Reports using its REST API in 4 Steps.

Luckily there is a good swagger documentation around that can be accessed on this URL:
https://<aria operations url>/suite-api/doc/swagger-ui.html

But now lets get into it:

1. Authentication

The authentication is handled via token that can be acquired on following endpoint:

POST https://<aria operations url>/suite-api/api/auth/token/acquire
Body of the request:

{
  "username" : "",
  "authSource" : "<domain name or local for local auth>",
  "password" : ""
}

This post call will provide a token which need to be used from now on for all other calls.

2. Retrieve data about ReportDefinitions

GET https://<aria operations url>/suite-api/api/reportdefinitions?name=my+capacity+report

Add this as Header Parameter:

Authorization: vRealizeOpsToken <token from privous call>

The name filter is optional but helpful in case you have many reports or you want to retrieve the reportdefinition Id of a single report.

3. Execute a report

POST https://<aria operations url>/suite-api/api/reports

Keep the header paramter:

Authorization: vRealizeOpsToken <token from privous call>

The reportDefinitionId can be retrieved from privouse call and the resourceId describes the resource on which the report should be executed. Therefore I would recommend you to run manually a report on the desired resource and to gather the ID with the GET method:
GET https://<aria operations url>/suite-api/api/reports

The body for the POST call should look like this:

{
  "resourceId" : "<resource ID>",
  "reportDefinitionId" : "<reportDefinitionId>",
 }

This call returns the ID of the report.

4. Download the Report

Final step is to download the report. Herby you can specify the format.
The default is PDF! If you want CSV it must be specified.

GET https://<aria operations url>/suite-api/api/reports/<Report ID>/download?format=csv

Remeber to keep the token set in the header.

Authorization vRealizeOpsToken <token from privous call>

The report ID can be obtained from step 3 or via a new call:

GET https://<aria operations url>/suite-api/api/reports

Some reports take a while until they are finalized. While they are still running they will return status “QUEUED”. So this need to be handled in some way when putting all calls together.

Troubleshoot instant clone provisioning errors

This week I encountered multiple weird symptoms on a Horizon Pool.
Everything started with the pool throwing many provisioning errors and eventually no more Desktops were in status ‘Available’. Later I noticed that it was not even possible to modify the number of Datastores on the pool (Infrastructure Change) or push a new image. Everything hang and stuck.

Since it is not easy to understand the origin of such problems I will describe in this post step-by-step how such errors can be troubleshooted.

On pool level mainly those error messages have been reported:

Provisioning error occurred for Machine <hostname>: Resync operation failed

Provisioning error occurred for Machine <hostname>: Cloning failed for Machine

Instant cloning failed is usually a good indicator that something is odd with the internal Horizon VMs (cp-template and cp-replica VMs). So the first action is to understand the relation of the pools Master Image and its internal Horizon VMs. In large environments there are many of these. So I navigated to the Pool Summary on the Connection Server and gathered the “Golden Image” name.

The iccleanup.cmd utility can help to understand the relation of the Golden Image with its internal Horizon VMs

It is usually located here on the connection server:

C:\Program Files\VMware\VMware View\Server\tools\bin

Syntax to start it:

iccleanup.cmd -vc vcName -uid userId [-skipCertVeri] [-clientId clientUuid]

Once the utility has loaded the ‘list’ command can be executed to retrieve the list of cp-template and cp-replica VMs. Sample output:

27. <Master-VM-Name>/<Snapshot-Name>
        cp-template-c09b6d60-26a2-4e24-b056-b45953f5289d
                cp-replica-3a6d1c1a-3d64-45ab-a0cd-c64fb69ce3a8
                        cp-parent-a8be9b73-6b65-4f83-b414-69445d7b3757
                        cp-parent-73b0f6a0-dae3-4df1-a5f5-845994162edc
                        cp-parent-036101da-8e16-4ef0-8b81-ad2129b3e0a9
                cp-replica-d90ac860-47d3-46eb-bde5-dccf16025e27
                        cp-parent-a66fc46d-d403-41a8-848b-88203aec299b
                        cp-parent-46bce3fe-63f8-41fc-a5f7-409d360c4b97
                cp-replica-24705be4-3104-4419-b906-d7b72aee9da7
                        cp-parent-320ff1de-23e2-476e-a735-4997a95e5368
                        cp-parent-4bs00f66-3888-4ffc-9e97-48485dd4ce2c

I copied the list and run through each cp-parent VM and its Tasks & Events to understand more about the cloning failed problem. But oddly none of the cp-parent VMs contained a recent cloning action (not even a failure that I expected). I have noticed two of the cp-parent VMs were offline and there was not a snapshot on it which is also strange. So apparently the cloning is not even starting..

I wanted to understand if the pool is able to handle other actions such as Infrastructure Change (triggered by changes of datastores mapped to the pool) or push image process. Also I wanted to isolate the issue a little further, so I edited the Pool and removed all datastores apart from 3. This triggered the infra change which is usually a quick activity when it is only about removal. (In the backend it will attempt to remove cp-replica VMs from Datastores that are no more in use). In my case it was everything but not quick. I went to our syslog solution to understand what the task is doing.

My first search was:

<Pool Name> publish* image

With this I retrieved the PendingOperation task:

PendingOperation-vm-1822770:snapshot-1822951-InfrastructureChange

This task stuck at 0% and eventually failed and restarted itself… and guess what: failed again:

2024-02-08T15:10:04.091+01:00 ERROR (1B88-3394) [NgvcHelper] Unprime of pool <Pool Name> has failed. Timed out waiting for operation to complete. Total time waited 30 mins

So I went through the logs of this PendingOperation and noticed some events in which the instanceUUID of the Master VM was posted, so I went on and searched for it to see if there are some related events:

2024-02-08T14:09:43.813+01:00 DEBUG (1B88-3394) [VcCache] Getting virtual machine object for instanceUUID 5009cba1-bfb4-97f4-c957-3b5c7a760b65

And finally I found what I was hoping for, a task that was blocking everything:

2024-02-08T14:49:28.391+01:00 DEBUG (1B88-2F34) [LockManager] Task: ede1be65-08c6-4f41-8088-63681343ded3 is being BLOCKED because the needed lock combination: InternalVmLookupTask:Combination [lockGuid=ImageLinks-master.uuid=5009cba1-bfb4-97f4-c957-3b5c7a760b65&ss.id=1, type=READ] is currently owned by task: 37b6b3d1-8068-4247-83fc-4d7c827299be

I was able to link this task to a vCenter action “DisableDrsHaAction” which was a hanging operation on the Cluster that stuck at 0% greyed out…

So, finally the vCenter was restarted to kill this task. After the restart everything went on in the normal way.

I want to point out that this is not the only reason/trigger for such behaiovur within a Horizon environment. I saw situations in which a internal horizon VM got unprotected (usually they are protected and you cannot modify it) and moved by DRS to other datastores which caused the cloning operations to fail also. Or other situations in which the underlying storage system failed and internal horizon VMs got invalid. I hope this post can give you and idea how to start the troubleshooting when hitting such mess. The key is to have syslogs stored externally and to have debug log information enabled on Horizon side.

Extract NSX-t virtual Machine Security Tags with PowerShell

NSX, VMware’s network virtualization and security platform, allows you to apply security tags to virtual machines to define and enforce security policies and micro segmentation. Find here below a quick function that simplifies the TAG extraction. It requires only the user, password and uri as input parameters.
It will return an object array of all virtual Machines managed by NSX. This object also contains information about TAGs. The script will also handle pagination (the REST call returns 1000 results per page).
Tested on PowerShell 7 & NSX 4.1.

GitHub: https://github.com/maxioio/powershell_shorties

$username = "nsx-user"
$pass = Read-Host "Enter password" -AsSecureString
$mgr = "https://my-nsx-manager.com"

$vmarray = @()

# Function to extract 

FUNCTION get-NSXvmTags(){
    param(
        $username,
        $pass,
        $mgr
    )
    
    $vmarray = @()
    $cursor = $null

    $targeturi = "/api/v1/fabric/virtual-machines"
    
    $uri = $mgr + $targeturi
    $password = [System.Runtime.InteropServices.Marshal]::PtrToStringAuto([System.Runtime.InteropServices.Marshal]::SecureStringToBSTR($pass))
    $userpass  = $username + ":" + $password

    $bytes= [System.Text.Encoding]::UTF8.GetBytes($userpass)
    $encodedlogin=[Convert]::ToBase64String($bytes)
    $authheader = "Basic " + $encodedlogin
    $header = New-Object "System.Collections.Generic.Dictionary[[String],[String]]"
    $header.Add("Authorization",$authheader)
    $res = Invoke-RestMethod -Uri $uri -Headers $header -Method 'GET'
    
    $vmarray += $res.results
    $cursor = $res.cursor
    Write-Host($vmarray.count)


    while ($cursor -ne $null) {
        $targeturi = "/api/v1/fabric/virtual-machines"
        
        if ($cursor -ne $null) {
            $targeturi += "?cursor=" + $cursor
        }
    
        $uri = $mgr + $targeturi
    
        $res = Invoke-RestMethod -Uri $uri -Headers $header -Method 'GET'
        
        $vmarray += $res.results
        $cursor = $res.cursor
    }
    
    return $vmarray
}

$vmarray = get-NSXvmTags $username $pass $mgr